Noah Wright

Data Strategy • Performance Analytics • Public Service • R Coding • Visualization
LinkedIn
Professional Work - Publications - Personal Projects - About
Professional Work
Texas Juvenile Justice Department
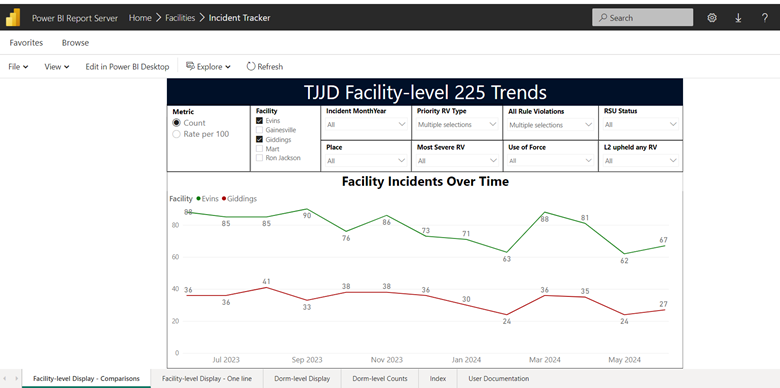
Performance dashboards
Business lead in setup of Power BI report server deployment for agency. Created multiple dashboards monitoring facility incidents, employee turnover, overtime usage, and other agency processes.
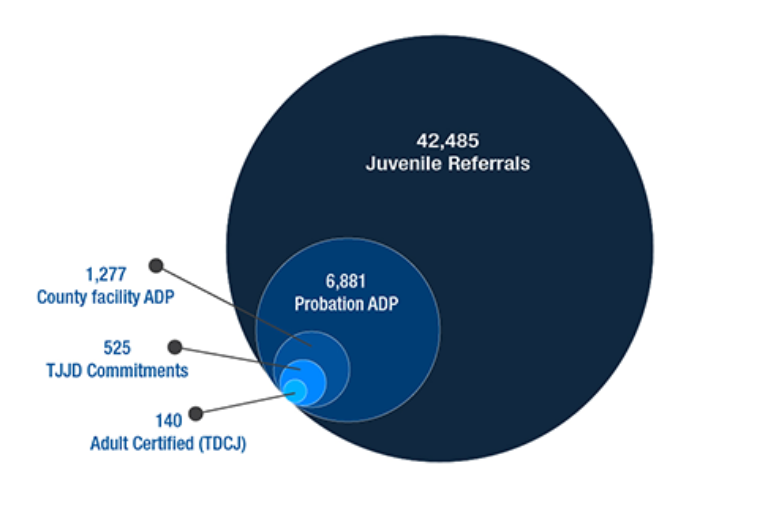
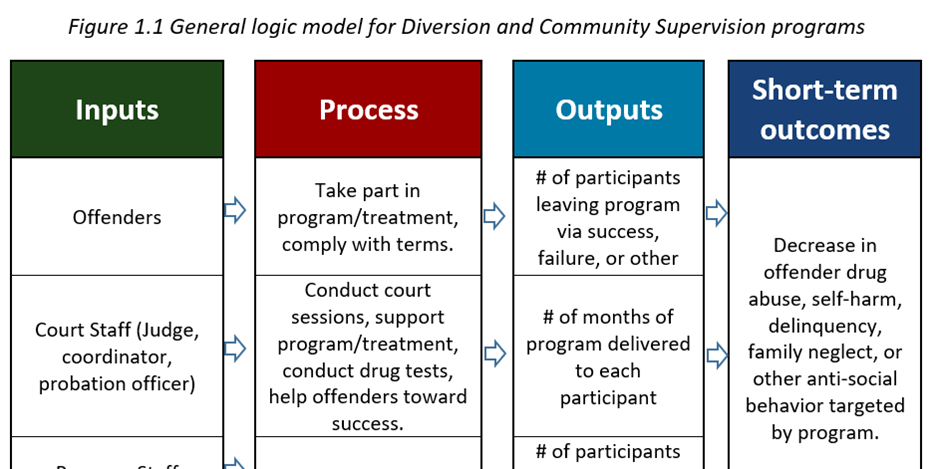
One-pagers
Developed explanatory documents of juvenile justice system and processes for external stakeholders. Samples available on TJJD website
Public Presentations
Regularly provided updates to TJJD governing board and executive staff on the current state of the juvenile justice system. Example:
TJJD Governing Board, May 24, 2024 (Materials) (Video - 58:00)
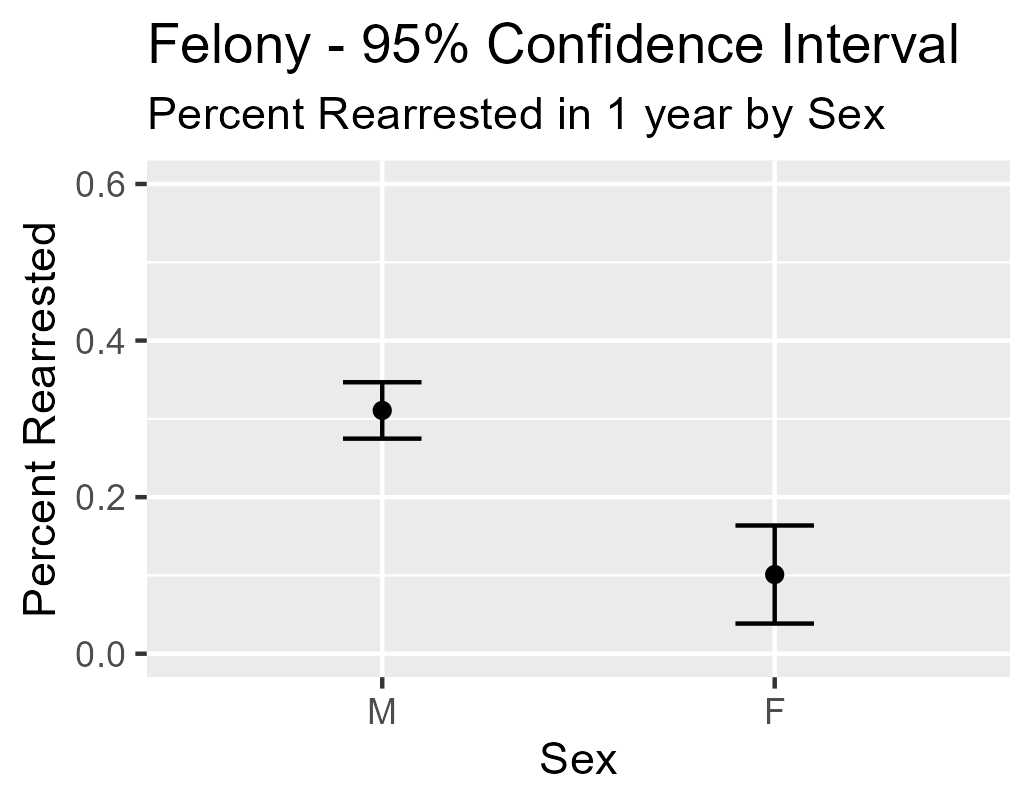
Data science
Modeled population projections and assessed the impact release criteria and youth characteristics have on recidivism.
Criminal Justice Division of Texas’ Office of the Governor
Portfolio Review
Performance assessments of all agency grants organized by funding source and program type.
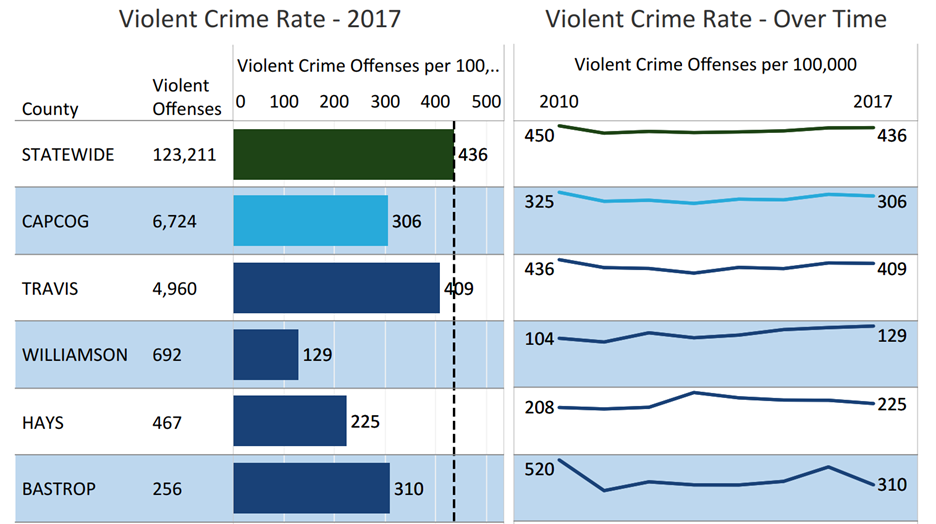
Resources for Local Criminal Justice Planning
Annual compilation of criminal justice and victims services data produced for each of the 24 Councils of Government of Texas.
Publications
This article details my work with the initial roll-out of body-worn camera monitoring at the Texas Juvenile Justice Department.

“The Politics of Performance Measurement.” Real World Data Science, April 18, 2023.
This article details how I developed and implemented the performance assessment system for specialty courts in the State of Texas, and how that system became defunct.

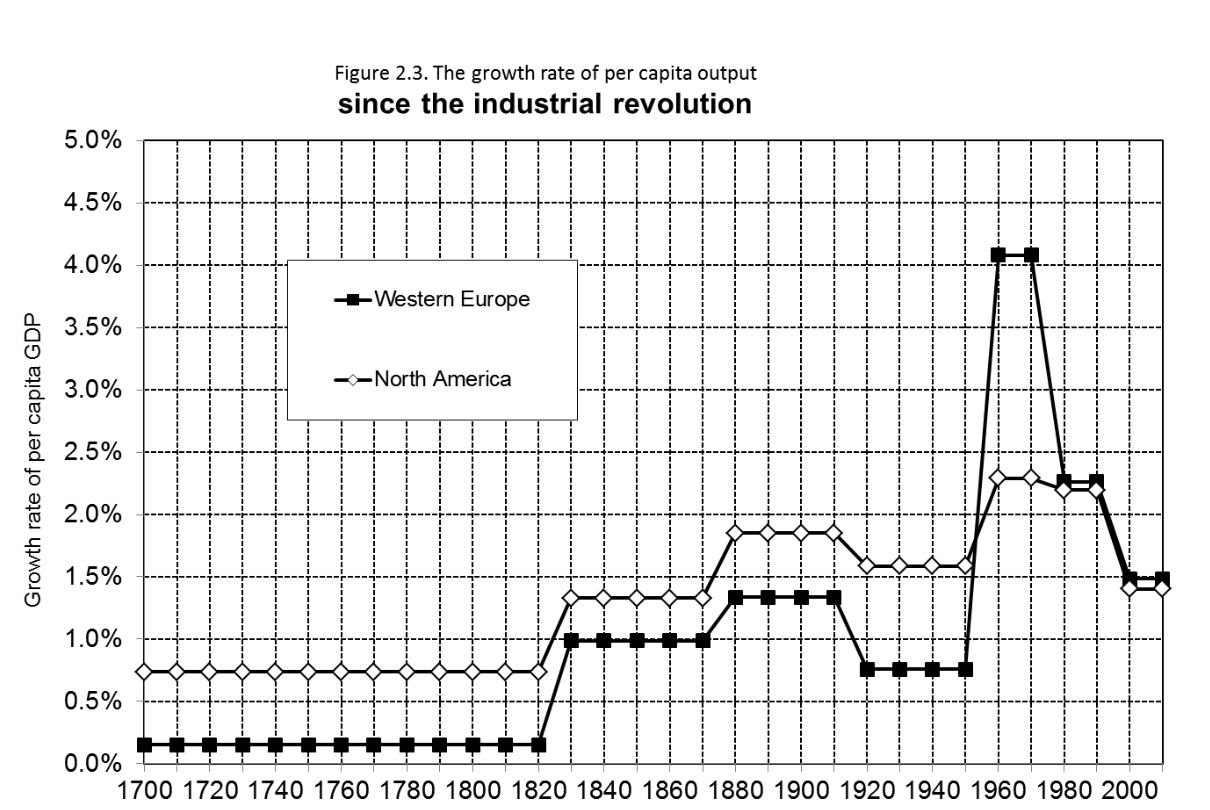
“Data Visualization in Capital in the 21st Century” World Economic Review 5: 54-72, 2015.
Critique of Thomas Piketty’s misleading use of data visualization in Capital in the 21st Century
Personal Projects
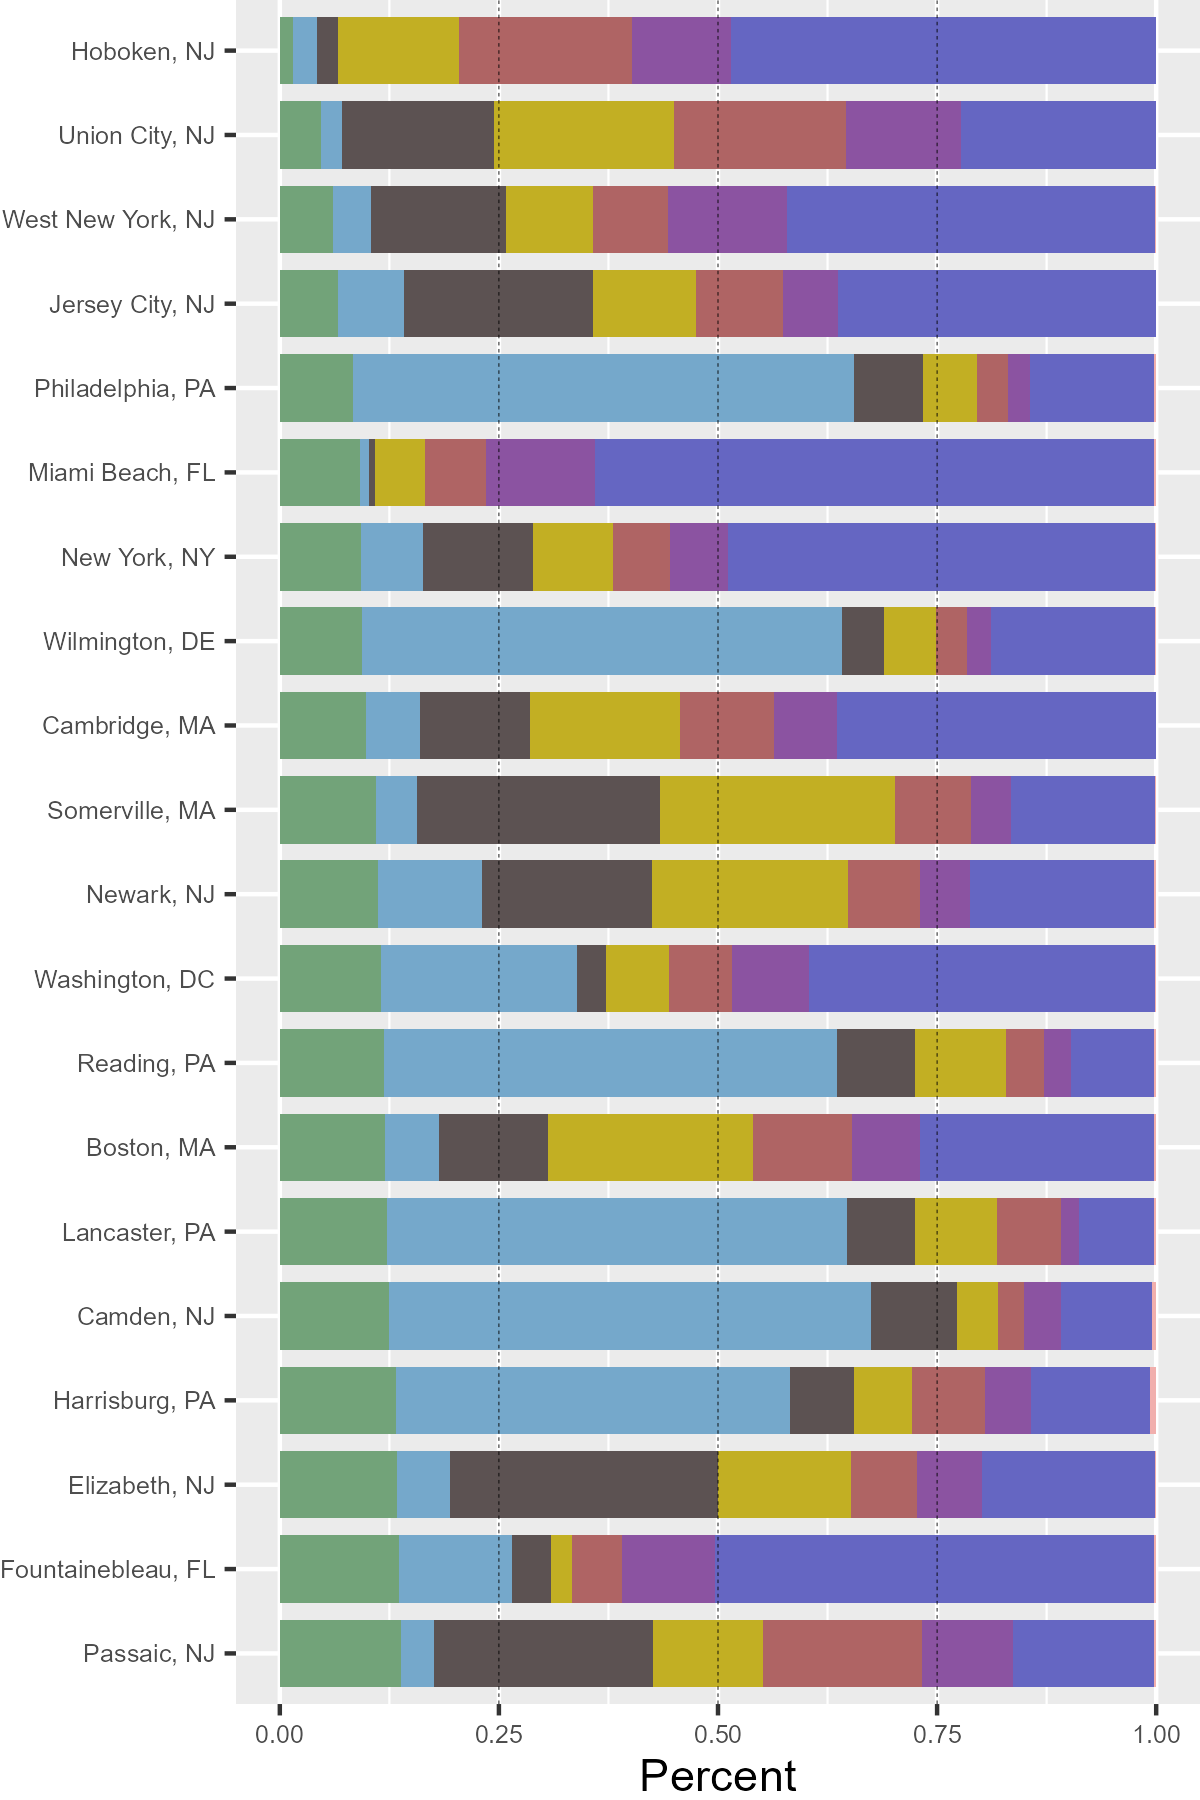
U.S. Housing by Occupied Unit Count
Used census data to create an extension of a Washington Post analysis of U.S. city housing unit types (single-family detached, missing middle, etc.). Also created a version for Chicago neighborhoods
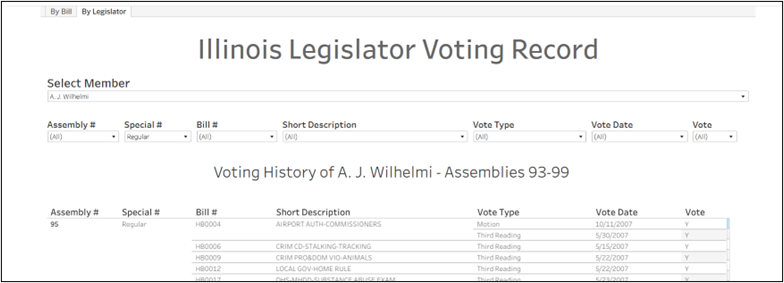
Illinois Legislative Vote Tracker
Scraped 76,000+ vote record PDF’s from ilga.gov and created structured dataset for ease of analysis. Published simple Tableau interface (linked above) for 93rd-99th General Assembly. Please follow up if interested in more recent sessions.
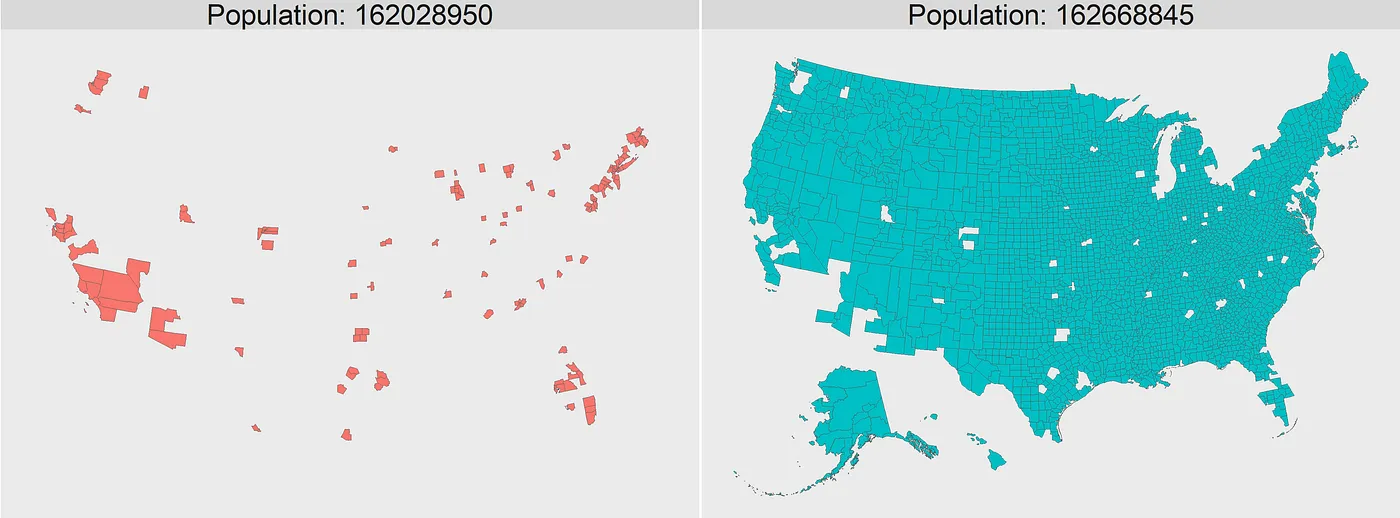
These Two Maps Have Equal Population
Compared permutations of U.S. population density display maps and their implications.
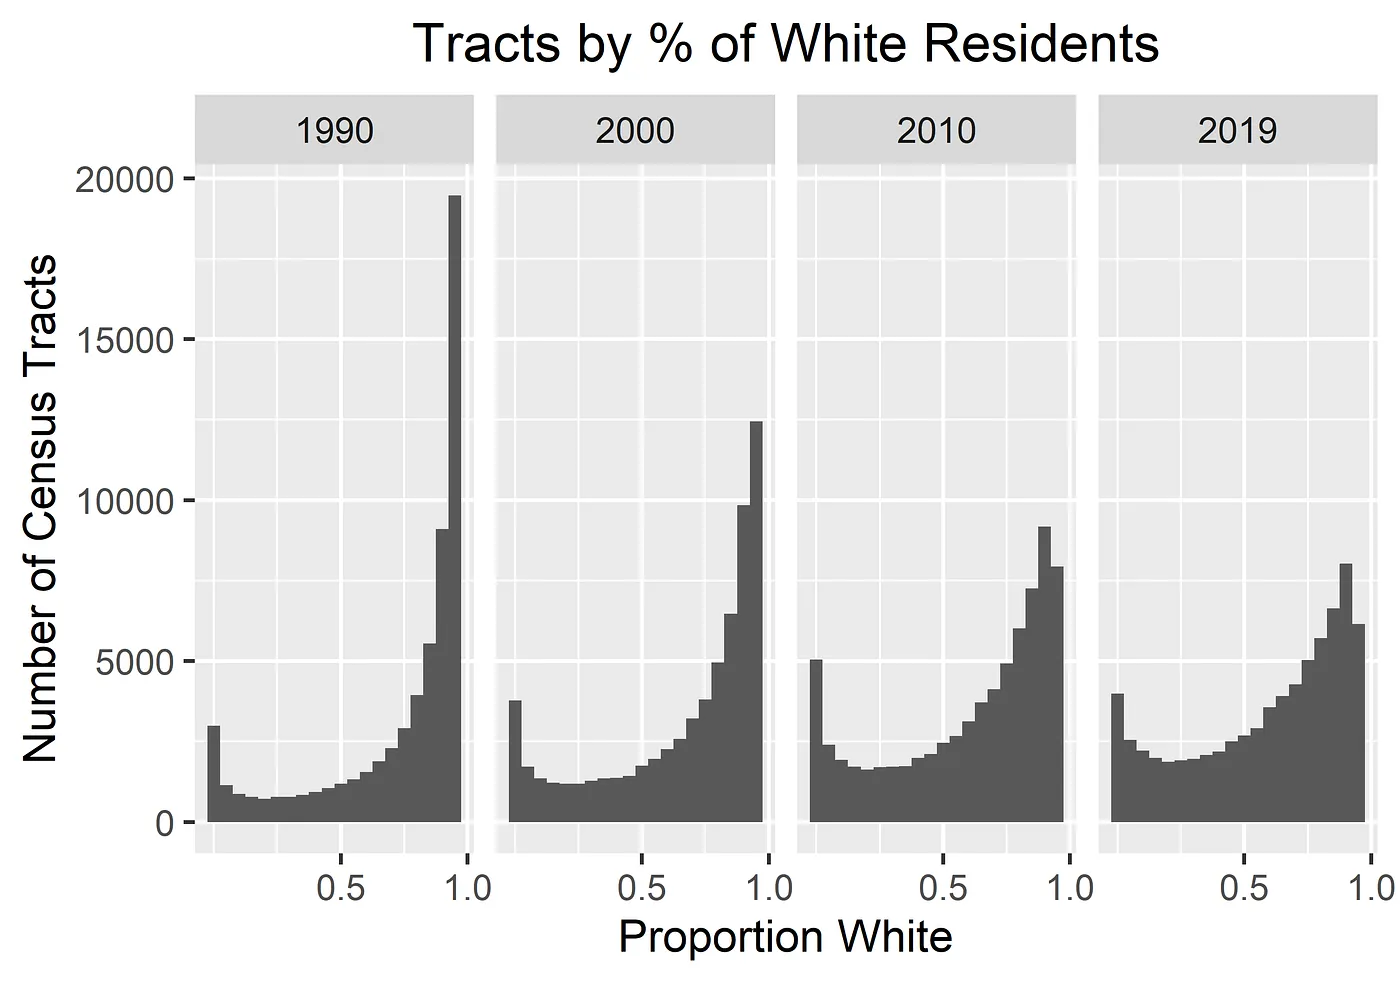
What is “Majority-Minority” and Why is it Stupid to Obsess Over?
Analyzed long-term American demographic trends, and why they aren’t that big of a deal.
About
Noah Wright is a data professional with over a decade of experience in quantitative research, analytics, grantmaking, teaching, and management. In his career he has worked on topics including criminal justice, education, workforce development, poverty, and urban issues.
He currently works as a Data Strategist for the Texas Juvenile Justice Department and volunteers for local pro-housing organizations. In his free time he overthinks pop culture and hosts a book club on the history of Chicago
Page template forked from evanca